
Bitcoin and altcoins must rebound off their immediate support levels to recapture bullish momentum and resume the uptrend.

Chicago Mercantile Exchange’s cash-settled Bitcoin (BTC) futures trading products “contribute more to price discovery than its related spot markets,” according to findings in a new report by investment firm Wilshire Phoenix.
The increasing volumes of crypto derivative products highlight greater participation from institutional investors and this will likely be positive for the entire crypto space.
This is not unique to cryptocurrencies because even in most other asset classes, the derivatives markets lead the spot markets.
In a separate attempt to determine the valuation of Bitcoin, several experts from JPMorgan Chase opined that Bitcoin’s price is overvalued compared to its intrinsic value and the analysts suggested that BTC could face selling in the short-term.
The
analysts consider Bitcoin to be a commodity and have calculated its
marginal cost of production to estimate its intrinsic value.
While
fundamentals do work in the long-term, short-term price action is
usually dictated by sentiment and technicals. Let’s analyze the charts
of the top-10 cryptocurrencies to determine the path of least
resistance.
BTC/USD
Bitcoin (BTC)
bounced off the $11,178 support on Oct. 15 but the bulls could not
sustain the price above $11,500. This weakness could have attracted
profit booking by the short-term traders and shorting by the aggressive
bears.

The
bears are currently attempting to sink the price back below the
critical support at $11,178. However, this level is likely to attract
buyers because the 20-day exponential moving average ($11,081) is placed
just below this support.
The upsloping 20-day EMA and the relative strength index in the positive territory suggest that buyers have the upper hand.
If
the bulls can push the price above the downtrend line, it will be the
first sign of strength. The uptrend could pick up momentum after the
bulls can sustain the BTC/USD pair above the ascending channel.
Contrary
to this assumption, if the bears sink the pair below the 20-day EMA, a
drop to the support line of the channel is possible. A breakdown of the
channel could spark further selling, which could result in a drop to
$10,000.
ETH/USD
The bears are currently attempting to sustain Ether (ETH)
below the moving averages. If they succeed, a drop to the uptrend line
is possible. If this support also cracks, it will indicate a range-bound
action for the biggest altcoin for a few more days.

The flat moving averages and the RSI near 50 also point to a balance between supply and demand.
However,
if the ETH/USD pair turns up from the current levels or the uptrend
line, the bulls will again try to push the price above the overhead
resistance at $395. If they can pull it off, it will complete an
ascending triangle pattern that has a target objective of $481.608.
XRP/USD
XRP
broke below the moving averages on Oct. 15 and is on its way to the
critical support at $0.2295. Although the altcoin had formed a bullish
inverse head and shoulders pattern, the bulls could not push the price
above the neckline at $0.26 and the setup did not complete.

The
current price action of the altcoin is a good example of why traders
should wait for the setup to complete before taking a directional bet.
Buying in anticipation could quickly turn the trade into a loss.
The
XRP/USD pair is currently range-bound between $0.2295 and $0.26, hence,
the bulls are likely to buy near the support of the range.
A trending move will start after the bulls push the price above $0.26 or the bears sink the pair below $0.219712.
BCH/USD
Bitcoin Cash (BCH)
witnessed sharp selling at $266.46 that resulted in a retest of the
breakout level at $242. The sharp rebound off this support suggests that
the bulls aggressively accumulated at lower levels and $242 has now
flipped from resistance to support.

The
upsloping 20-day EMA ($238) and the RSI above 60 suggests that the
bulls have the upper hand. If the buyers can push the price above
$266.46, the uptrend could reach $280 and then $300.
This
assumption will be invalidated if the bears sell at the current levels
and sink the BCH/USD pair below the moving averages. If that happens,
the pair could again drop to $215.
BNB/USD
Binance Coin (BNB)
has turned around from $31.9798 today as the bears attempt to stall the
uptrend and sink the price back below the support at $29.5646 and the
20-day EMA at $28.77.

If
the sellers can manage to sustain the price below the 20-day EMA, it
will suggest that the bullish momentum has weakened. A break below $26
could suggest the start of a deeper correction to $22.
However, if the BNB/USD pair rises from the $22.5646 support or the 20-day EMA, the bulls will again try to resume the uptrend.
A
strong rebound will suggest that the bulls are aggressively
accumulating on dips, while a weak rebound will indicate a lack of
demand, hence, the bears could pounce on it.
Therefore, traders
can keep an eye on the strength of the rebound to determine whether the
up-move will resume or the rally will fizzle out at higher levels.
LINK/USD
Chainlink (LINK)
turned down from the 50-day simple moving average ($11.22) on Oct. 13
but the positive thing is that the bulls are attempting to arrest the
pullback at the 20-day EMA ($10.40).

A
strong rebound off the 20-day EMA will be the first sign that the
sentiment has turned from sell on rallies to buy on dips. The first
target is $12 and above this, the LINK/USD pair could reach $13.28.
However,
if the rebound off the 20-day EMA is weak, it may again face stiff
resistance at the 50-day SMA. If the pair once again turns down from
this overhead resistance, it will increase the possibility of a decline
to $8.7975.
DOT/USD
Polkadot (DOT)
has turned down from the 20-day EMA ($4.22) and the bears will now try
to sink the price below the $3.5321 support. If the bears manage a close
(UTC time) below $3.5321, it will complete a descending triangle
pattern.

This
bearish setup has a target objective of $1.4743. However, it may not be
a straight fall to this level because the bulls could step in and
provide support at $2.60 and again at $2.
Contrary to this
assumption, if the DOT/USD pair turns up from the current levels or
rebounds off $3.5321, the bulls will try to push the price above the
resistance line of the descending triangle.
If that happens, it will invalidate the bearish pattern and that could result in an up-move to $4.6112 and then $5.5899.
ADA/USD
The bulls could not drive Cardano (ADA)
above the neckline of the possible inverse head and shoulders pattern.
This could have attracted profit booking by the short-term bulls and
selling by the aggressive bears resulting in a drop to the 20-day EMA
($0.10).

As
the 20-day EMA is sloping up marginally and the RSI is in the positive
zone, the bulls may defend this support. If the ADA/USD pair rebounds
off the 20-day EMA, the bulls will try to push the price above the
neckline.
If they succeed, the pair could start a new uptrend that may reach $0.128062 and above it $0.1445.
This
positive view will be invalidated if the pair continues to slip and it
breaks below the 50-day SMA ($0.098). Such a move could result in a drop
to $0.090.
LTC/USD
Litecoin (LTC)
has dropped below both moving averages today, which suggests that the
bears used the rally to the $51 resistance to initiate short positions.
However, the bulls have not yet given up as they are currently
attempting to defend the uptrend line.

If
the bulls fail to push the price above the moving averages, the selling
is likely to intensify and the bears will once more try to sink the
LTC/USD pair below the uptrend line. If they succeed, a drop to $42 is
possible.
Conversely, if the pair rises above the moving averages,
the bulls will try to thrust the price above the $51–$52.36 resistance
zone. If they succeed, the inverse head and shoulders pattern will
complete and it has a target objective of $60.3702.
BSV/USD
Bitcoin SV (BSV)
has broken below the moving averages and is now likely to remain
range-bound between $180.63 and $146.20. The fall today has invalidated
the possibility of an inverse head and shoulders pattern.

The
20-day EMA ($166) is flat but the 50-day SMA ($167) is sloping down and
RSI has dropped below 42, which suggests a slight advantage to the
bears. A break below $146.20 could start a new downtrend.
However,
if the BSV/USD pair recovers from the current levels or from the
$146.20 support, the bulls will make one more attempt to drive the price
above $180.63. A close (UTC time) above this resistance could start an
up-move to $210.
The views and opinions expressed here are
solely those of the author and do not necessarily reflect the views of
Cointelegraph. Every investment and trading move involves risk. You
should conduct your own research when making a decision.
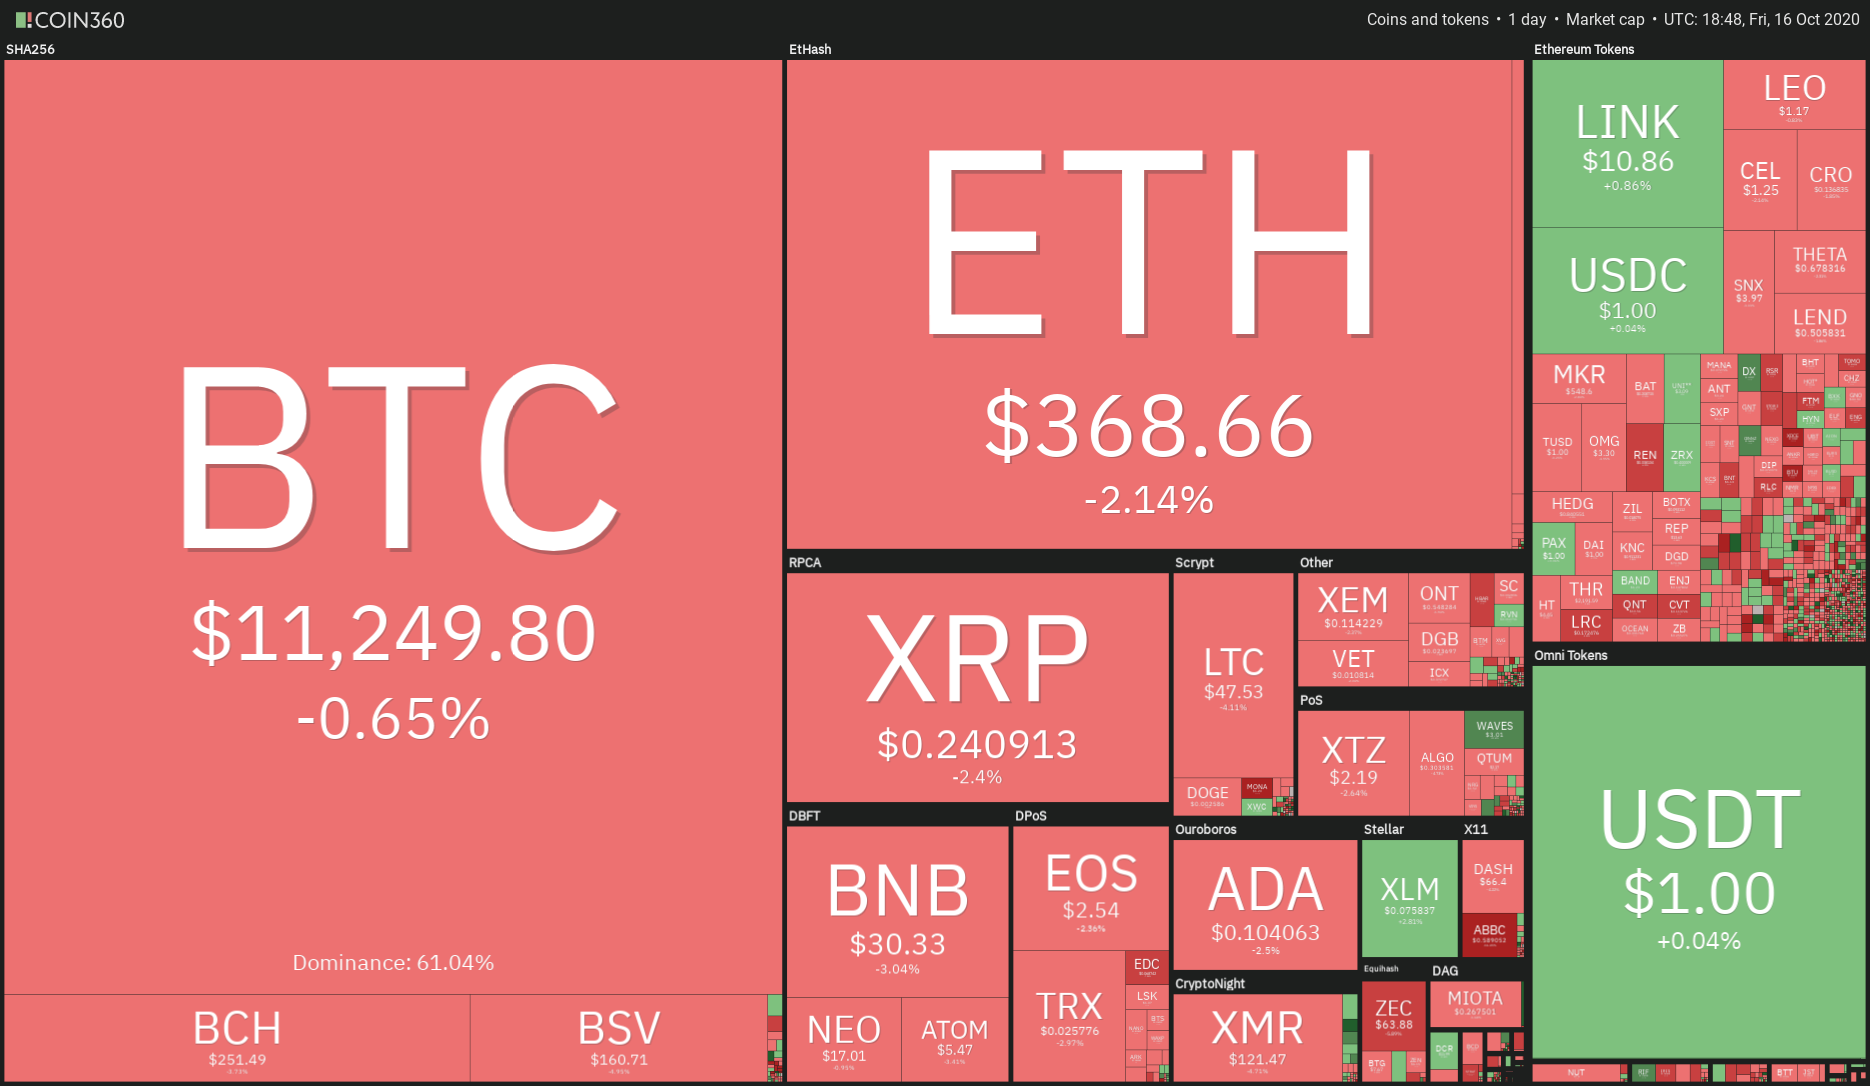
Market data is provided by HitBTC exchange.
souce link : https://cointelegraph.com/news/price-analysis-10-16-btc-eth-xrp-bch-bnb-link-dot-ada-ltc-bsv


